In the fast-paced digital world, where smooth operation and constant access are paramount, understanding system uptime holds immense significance. Uptime, simply put, refers to the duration a system has been operational without rebooting or experiencing downtime. It directly impacts performance, stability, and overall user experience. Whether you’re a seasoned IT professional or simply someone who relies on their computer for daily tasks, knowing how to check system uptime and understand its implications is crucial.
Why Uptime Matters: Unlocking Peak Performance and Stability
Extended uptime translates to uninterrupted operation, allowing applications to run seamlessly, data to be readily accessible, and users to complete tasks without disruptions. Reduced downtime translates to increased productivity, enhanced user satisfaction, and a more positive overall experience. Conversely, frequent downtimes lead to lost productivity, frustrated users, and potential financial losses. Monitoring uptime empowers you to identify potential issues before they arise, take proactive measures to prevent downtime, and ensure optimal system performance.
Unveiling the Diverse Methods for Different Operating Systems
The methods for checking system uptime vary across different operating systems. This article will delve into the intricacies of checking uptime on Windows, macOS, and Linux, providing you with the necessary tools and knowledge to become an uptime master.
II. Check System Uptime on Windows
For Windows users, multiple avenues lead to uncovering the uptime secrets of their systems.
A. Command Prompt Commandos (CMD method):
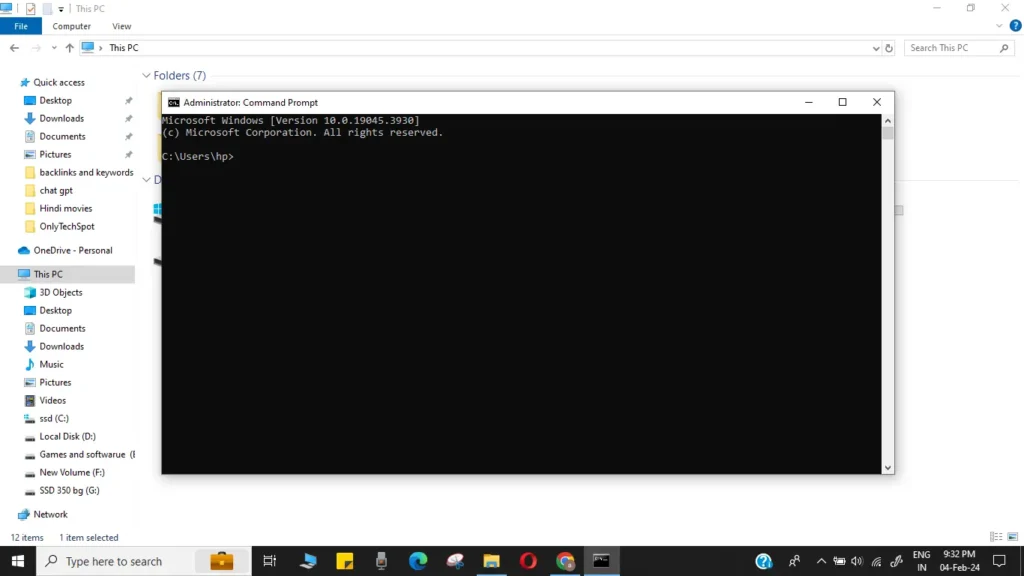
- “net statistics server/workstation”: This command, when executed in Command Prompt as administrator, reveals a wealth of information about your system’s network connections. The line labeled “Statistics since” displays the exact time your system last booted, providing a clear picture of its uptime.
- “systeminfo”: Another valuable Command Prompt tool, “systeminfo” offers a comprehensive overview of your system configuration. Look for the line labeled “System Up Time,” which displays the system’s uptime in days, hours, minutes, and seconds, giving you a precise understanding of its operational duration.
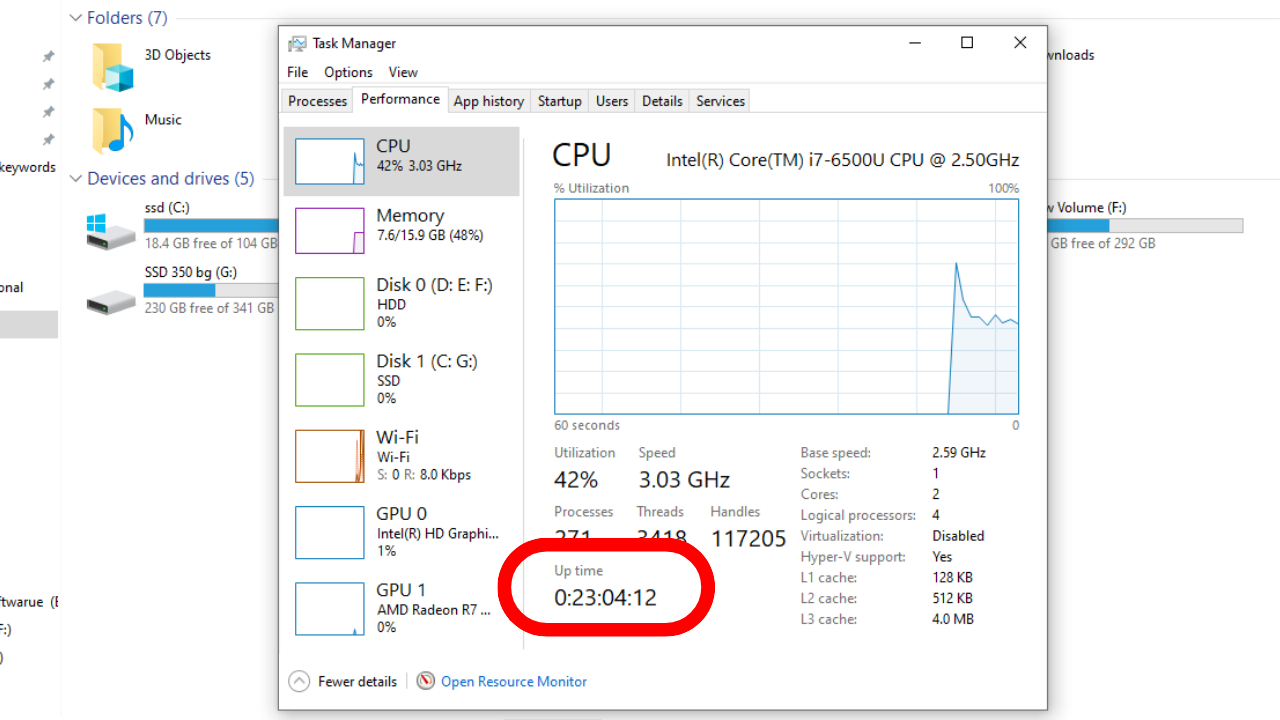
B. Task Manager: A Graphical Uptime Gauge
For those who prefer a visual representation, the Task Manager serves as a handy uptime monitor. Open the Performance tab and locate the “Uptime” section under System Information. This provides a straightforward reading of your system’s uptime, readily accessible within a familiar interface.
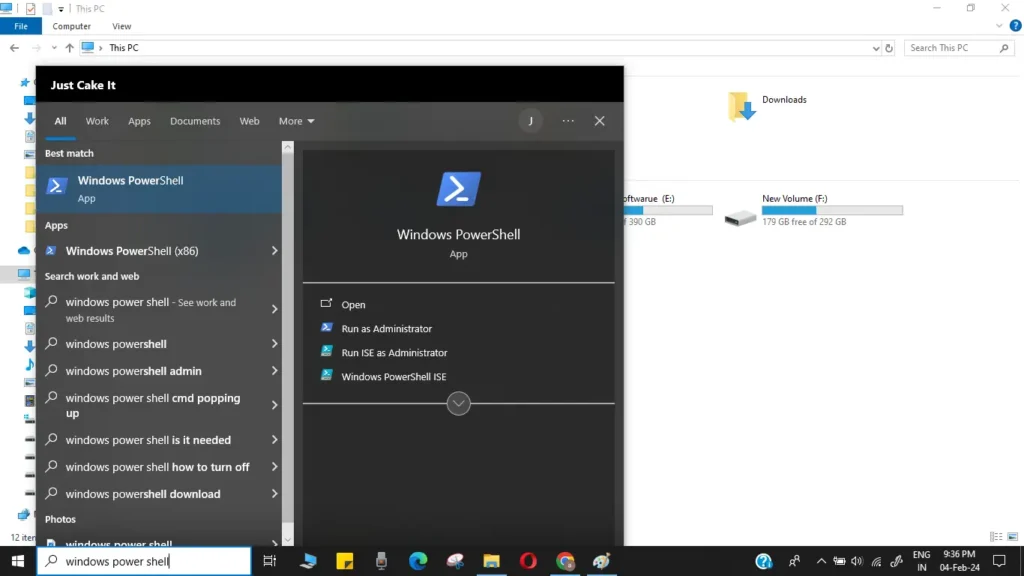
C. PowerShell Prowess:
PowerShell aficionados can leverage built-in cmdlets to unveil uptime secrets. The “(get-date) – (gcim Win32_OperatingSystem).LastBootUpTime” command calculates the difference between the current date and time and the system’s last boot time, offering a precise uptime calculation in a PowerShell-specific format.
D. Third-Party Uptime Allies:
Beyond native tools, third-party applications like Speccy and HWMonitor offer detailed system information, including uptime readings, often presented in user-friendly interfaces and with additional system health insights.
III. Check System Uptime on macOS
For Apple users, macOS provides its own set of tools for uptime exploration.
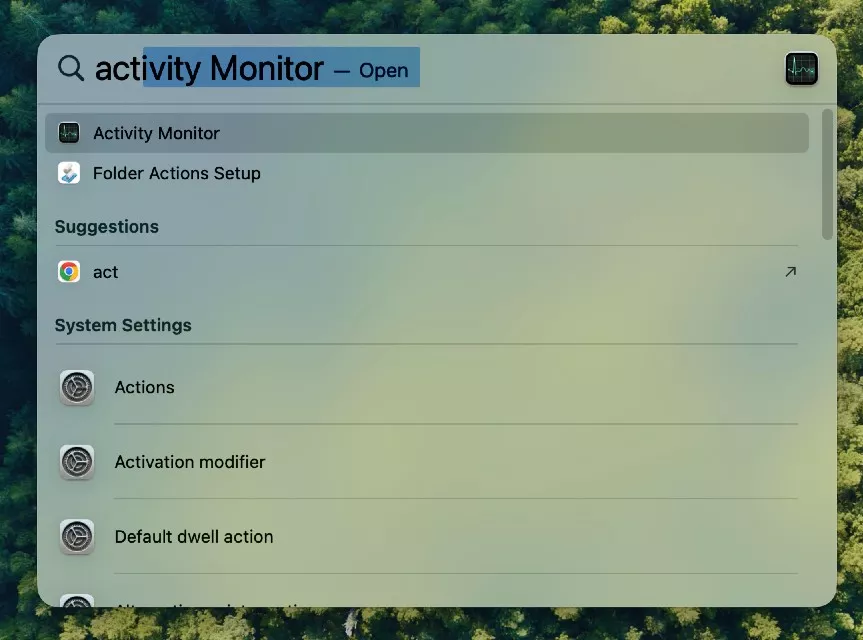
A. Activity Monitor: A Visual Uptime Dashboard
Launch the Activity Monitor, navigate to the “Overview” tab, and look for the “Uptime” field. This readily displays the duration your Mac has been operational since its last restart, offering a quick and convenient uptime check.
B. Terminal Commands: Unveiling Uptime with Code
The Terminal provides powerful command-line tools for uptime exploration.
- “uptime”: This simple command delivers a succinct response, displaying the system’s uptime in days, hours, and minutes. Perfect for a quick and efficient uptime check.
- “sysctl kern.boottime”: This command delves deeper, showcasing the system’s boot time in Unix timestamp format. While less user-friendly for casual users, it offers valuable information for advanced analysis.
C. Third-Party Uptime Allies:
Third-party applications like iStat Menus and CoconutBattery extend beyond basic uptime readings, offering comprehensive system monitoring features, including detailed historical uptime data and insightful performance visualizations.
IV. Exploring Uptime in the Linux Landscape
In the diverse world of Linux distributions, multiple methods exist to unveil uptime mysteries.
A. Terminal Commands: Demystifying Uptime through Code
- “uptime”: Similar to its macOS counterpart, the “uptime” command in Linux displays the system’s uptime in a clear and concise format, providing a quick snapshot of its operational duration.
- “w”: This versatile command offers a wealth of information, including the system’s uptime alongside details about logged-in users, system load, and start times. While offering more data than just uptime, it still provides a clear indication of the system’s operational duration.
B. System Logs: Unveiling the Uptime Narrative
System logs hold valuable historical data, including boot times and timestamps of various events. By analyzing these logs, you can glean insights into your system’s uptime history, identify potential issues, and track uptime trends over time. Tools like “tail” and “grep” can help you navigate and filter log files for relevant information.
C. Monitoring Tools: Unveiling Uptime Insights
Numerous third-party monitoring tools cater specifically to Linux environments, offering comprehensive uptime monitoring capabilities. Popular options include Munin, Nagios, and Zabbix. These tools provide user-friendly interfaces, historical data visualizations, alerting features, and integration with other system metrics for a holistic view of your system’s health and uptime.
V. Advanced Uptime Monitoring Techniques
Moving beyond basic checks, advanced techniques empower you to proactively monitor and analyse uptime.
A. Scripting Secrets: Automating Uptime Checks
Scripting languages like Python or Bash can be leveraged to automate regular uptime checks. You can create scripts that periodically run “uptime” commands, log the results, and trigger alerts if predefined thresholds are breached. This empowers you to stay ahead of potential issues and ensure consistent uptime.
B. Alerts and Notifications: Staying Ahead of Downtime
Configure your chosen monitoring tools or scripts to send alerts (via email, SMS, or push notifications) when uptime falls below acceptable levels. This allows for prompt intervention and minimises downtime impact.
C. Cloud-Based Uptime Guardians: Unveiling Remote Monitoring Power
Cloud-based monitoring services offer remote access to uptime data, enabling you to track uptime even when away from your physical system. These services provide real-time dashboards, historical data analysis, and centralised management, ideal for managing multiple systems or geographically dispersed infrastructure.
VI. Troubleshooting Uptime Woes
Even with proactive measures, downtime can occur. Here’s how to diagnose and resolve issues:
A. Identifying the Culprits: Common Uptime Disruptors
- Hardware failures: Faulty components like power supplies, hard drives, or RAM can lead to unexpected reboots and downtime.
- Software issues: Bugs, conflicts, or resource-intensive applications can trigger crashes and downtime.
- External factors: Power outages, network disruptions, or security breaches can also cause downtime.
B. Rebooting Realities: Resolving Unexpected Downtime
- Identify the cause: Analyze system logs, event viewers, and error messages to pinpoint the root cause of the downtime.
- Address the issue: Depending on the cause, solutions may involve replacing hardware, updating software, resolving conflicts, or mitigating external factors.
- Prevent future occurrences: Implement proactive measures like backups, redundancy, and security practices to minimize the risk of future downtime.
C. Optimising for Maximum Uptime: Maintaining Peak Performance
- Regular maintenance: Keep your system updated with the latest patches and security fixes to address vulnerabilities.
- Resource management: Monitor and optimize resource utilization (CPU, RAM, disk) to prevent performance bottlenecks and potential crashes.
- Hardware health checks: Regularly monitor hardware health using diagnostic tools to identify potential issues before they lead to downtime.
VII. Uptime Unveiled: Frequently Asked Questions
What secrets does system uptime reveal?
Uptime reflects the system’s stability and performance over time. Extended uptime indicates smooth operation, while frequent downtimes may suggest underlying issues.
Is longer uptime always better?
While longer uptime is generally desirable, short planned downtimes for maintenance or updates are necessary for long-term system health.
Can I monitor uptime remotely?
Yes, cloud-based monitoring services and remote access tools allow you to track uptime even when away from your physical system.
What tools can unlock deeper insights?
Monitoring tools provide historical data, visualizations, and alerts for comprehensive uptime analysis. Scripting can automate checks and personalize monitoring.
VIII. Conclusion: The Uptime Advantage
By understanding and actively monitoring system uptime, you gain valuable insights into your system’s health, stability, and performance. By employing the techniques outlined in this article, you can:
- Identify and address potential issues before they lead to downtime.
- Ensure optimal system performance and user experience.
- Minimize the impact of unplanned downtime.
Read more here for such content.